| Performance | |
|---|---|
| Lumens | 400 |
| Run Time | 168.0hr |
| Description | Retailer | Type | Component $ | Deal Total | Action |
|---|---|---|---|---|---|
|
ONE+ 18V Cordless 3-Tool Campers Kit with Area Light, Bluetooth Speaker, 4 in. Clamp Fan, 1.5 Ah Battery, and Charger
|
Home Depot | Sale |
$15.80
|
$89.00
$133.79
|
View |
|
4" Clamp Fan, Compact Speaker & LED Compact Area Light Kit
|
Home Depot | Regular |
$23.75
|
$133.79
|
View |
Home Depot
Ryobi
18V ONE+
ONE+ 18V Cordless 3-Tool Campers Kit with Area Light, Bluetooth Speaker, 4 in. Clamp Fan, 1.5 Ah Battery, and Charger
$89.00
$168.81
-47%
$16/Ah
Ends
Sale
1.5Ah Total

LED Compact Area Light
P796
$29.97
$15.80
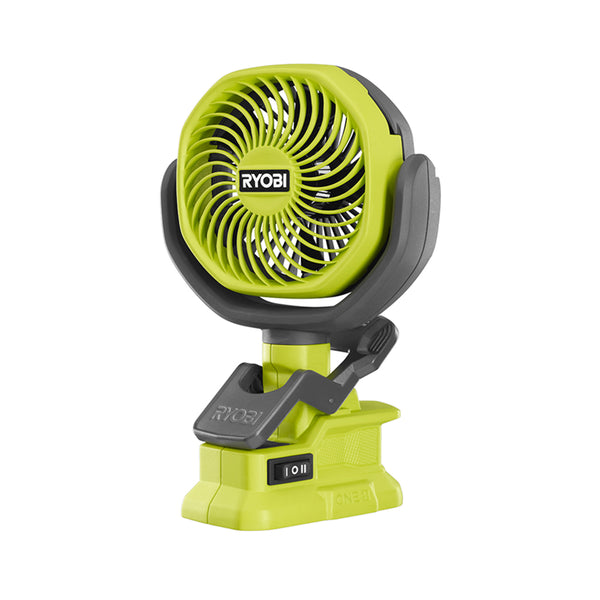
4" Clamp Fan
PCF02
$29.97
$15.80

Compact Speaker
PAD02
$28.93
$15.25
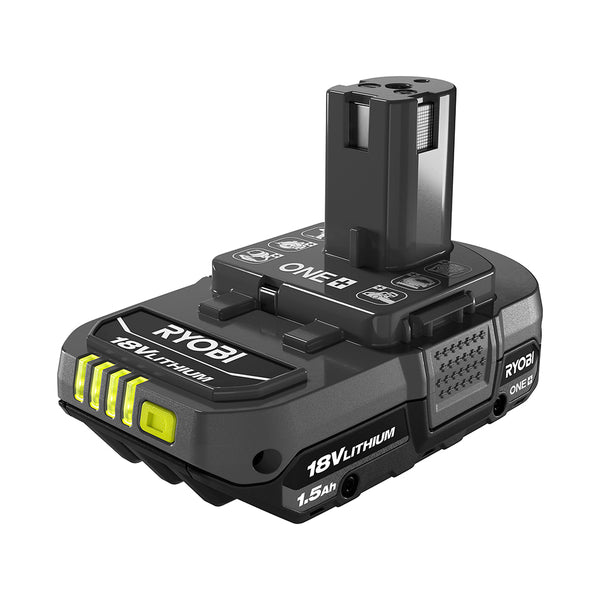
1.5Ah Battery
PBP002
$44.97
$23.71
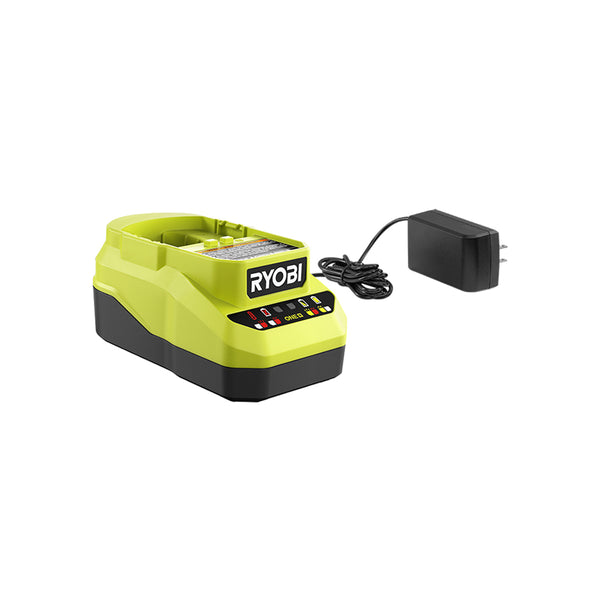
Charger
PCG002
$34.97
$18.44
View Deal
Home Depot
Ryobi
18V ONE+
4" Clamp Fan, Compact Speaker & LED Compact Area Light Kit
$133.79
$168.81
-21%
$24/Ah
1.5Ah Total
LED Compact Area Light
P796
$29.97
$23.75
4" Clamp Fan
PCF02
$29.97
$23.75
Compact Speaker
PAD02
$28.93
$22.93
1.5Ah Battery
PBP002
$44.97
$35.64
Charger
PCG002
$34.97
$27.72
View Deal
| Description | Retailer | Type | Component $ | Deal Total | Action |
|---|---|---|---|---|---|
|
4" Clamp Fan, Compact Speaker & LED Compact Area Light Kit
Expired
|
Home Depot | Daily Deal |
$10.47
|
$59.00
$133.79
|
View |
|
18V ONE+ LED Compact Area Light
Expired
|
Direct Tools Outlet | Sale |
$12.49
|
$12.49
$24.99
|
View |
|
ONE+ 18V Cordless 3-Tool Campers Kit with Area Light, Bluetooth Speaker, 4 in. Clamp Fan, 1.5 Ah Battery, and Charger
|
Home Depot | Sale |
$15.80
|
$89.00
$133.79
|
View |
|
4" Clamp Fan, Compact Speaker & LED Compact Area Light Kit
|
Home Depot | Regular |
$23.75
|
$133.79
|
View |
Sorted by price; showing up to 10 lowest observed offers.
Home Depot
Ryobi
18V ONE+
4" Clamp Fan, Compact Speaker & LED Compact Area Light Kit
$59.00
$168.81
-65%
Expired
Daily Deal
LED Compact Area Light
P796
$29.97
$10.47
4" Clamp Fan
PCF02
$29.97
$10.47
Compact Speaker
PAD02
$28.93
$10.11
1.5Ah Battery
PBP002
$44.97
$15.73
Charger
PCG002
$34.97
$12.22
View Deal
Direct Tools Outlet
Ryobi
18V ONE+
18V ONE+ LED Compact Area Light
$12.49
$29.97
-58%
Expired
Sale
LED Compact Area Light
P796
$29.97
$12.49
View Deal
Home Depot
Ryobi
18V ONE+
ONE+ 18V Cordless 3-Tool Campers Kit with Area Light, Bluetooth Speaker, 4 in. Clamp Fan, 1.5 Ah Battery, and Charger
$89.00
$168.81
-47%
Ends
Sale
LED Compact Area Light
P796
$29.97
$15.80
4" Clamp Fan
PCF02
$29.97
$15.80
Compact Speaker
PAD02
$28.93
$15.25
1.5Ah Battery
PBP002
$44.97
$23.71
Charger
PCG002
$34.97
$18.44
View Deal
Home Depot
Ryobi
18V ONE+
4" Clamp Fan, Compact Speaker & LED Compact Area Light Kit
$133.79
$168.81
-21%
LED Compact Area Light
P796
$29.97
$23.75
4" Clamp Fan
PCF02
$29.97
$23.75
Compact Speaker
PAD02
$28.93
$22.93
1.5Ah Battery
PBP002
$44.97
$35.64
Charger
PCG002
$34.97
$27.72
View Deal
Best Standalone
—
Best Kit
$15.80
90d Low Standalone
$12.49
90d Low Kit
$10.47
Price Trend: Shows list price, best standalone offer, and average kit price over time.
Bubble Chart: Individual offers with bubble size representing component effective price.
Loading price trend...
Price trend data not available
List Price
Best Standalone
Avg Kit Price
No offer data available for bubble chart.
Loading comparison...
Failed to load comparison data.
Ryobi
18V ONE+
18V ONE+ LED Compact Area Light
P796
List Price
$29.97
Best Offer
$15.80
SPECIFICATIONS
| Performance | |
|---|---|
| Lumens | 400 |
| Run Time (hr) | 168.0 |
OFFERS
| Description | Retailer | Type | Component $ | Deal Total |
|---|---|---|---|---|
| ONE+ 18V Cordless 3-Tool Campers Kit … | Home Depot | Sale | $15.80 | $89.00 |
| 4" Clamp Fan, Compact Speaker & … | Home Depot | Regular | $23.75 | $133.79 |
Component $ = offer price allocated across kit components by list price ratio.
Component Decoded
•
tooldecoded.com